Index of /sereno/csurf/fsaverage-labels/CsurfMaps1-illustrations
##########################################################################################
https://pages.ucsd.edu/~msereno/csurf/fsaverage-labels/CsurfMaps1-illustrations/README.txt
##########################################################################################
FIGURE CAPTIONS
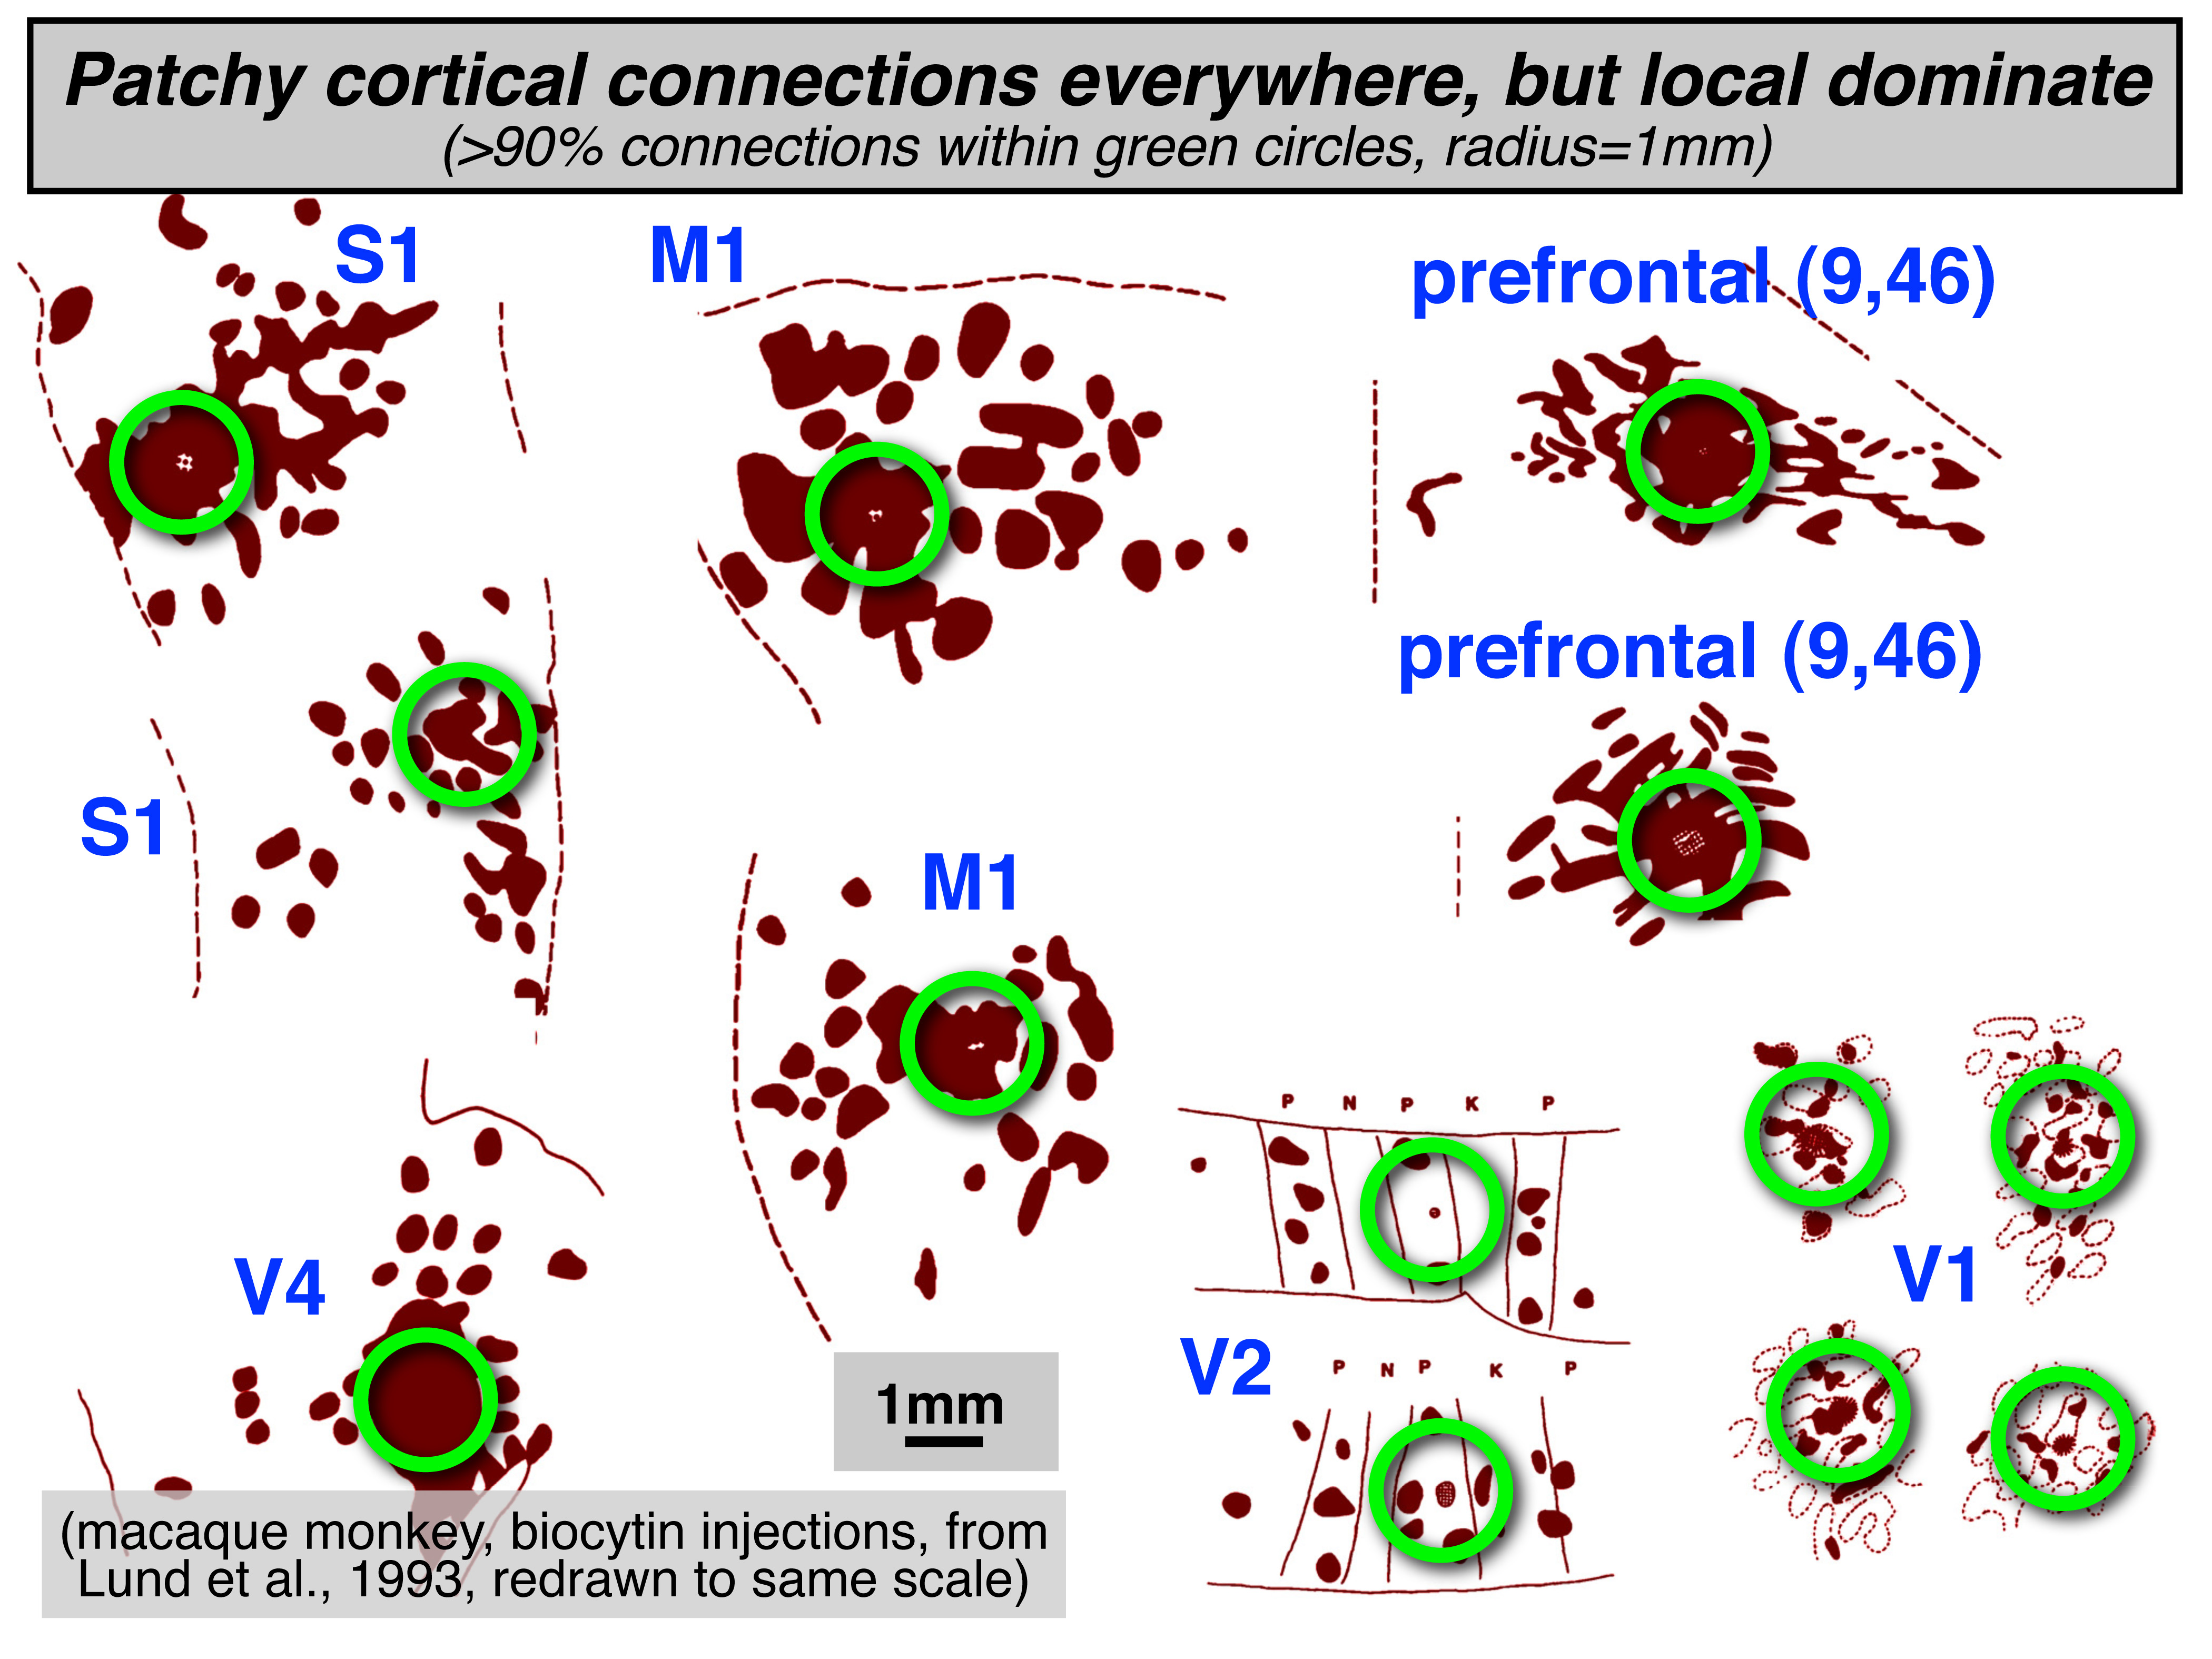
Figure 1. Patchy local structures and connections are found everywhere
in the cortex. However, the numerical majority of connections are made
within a 1 mm radius (green circles).
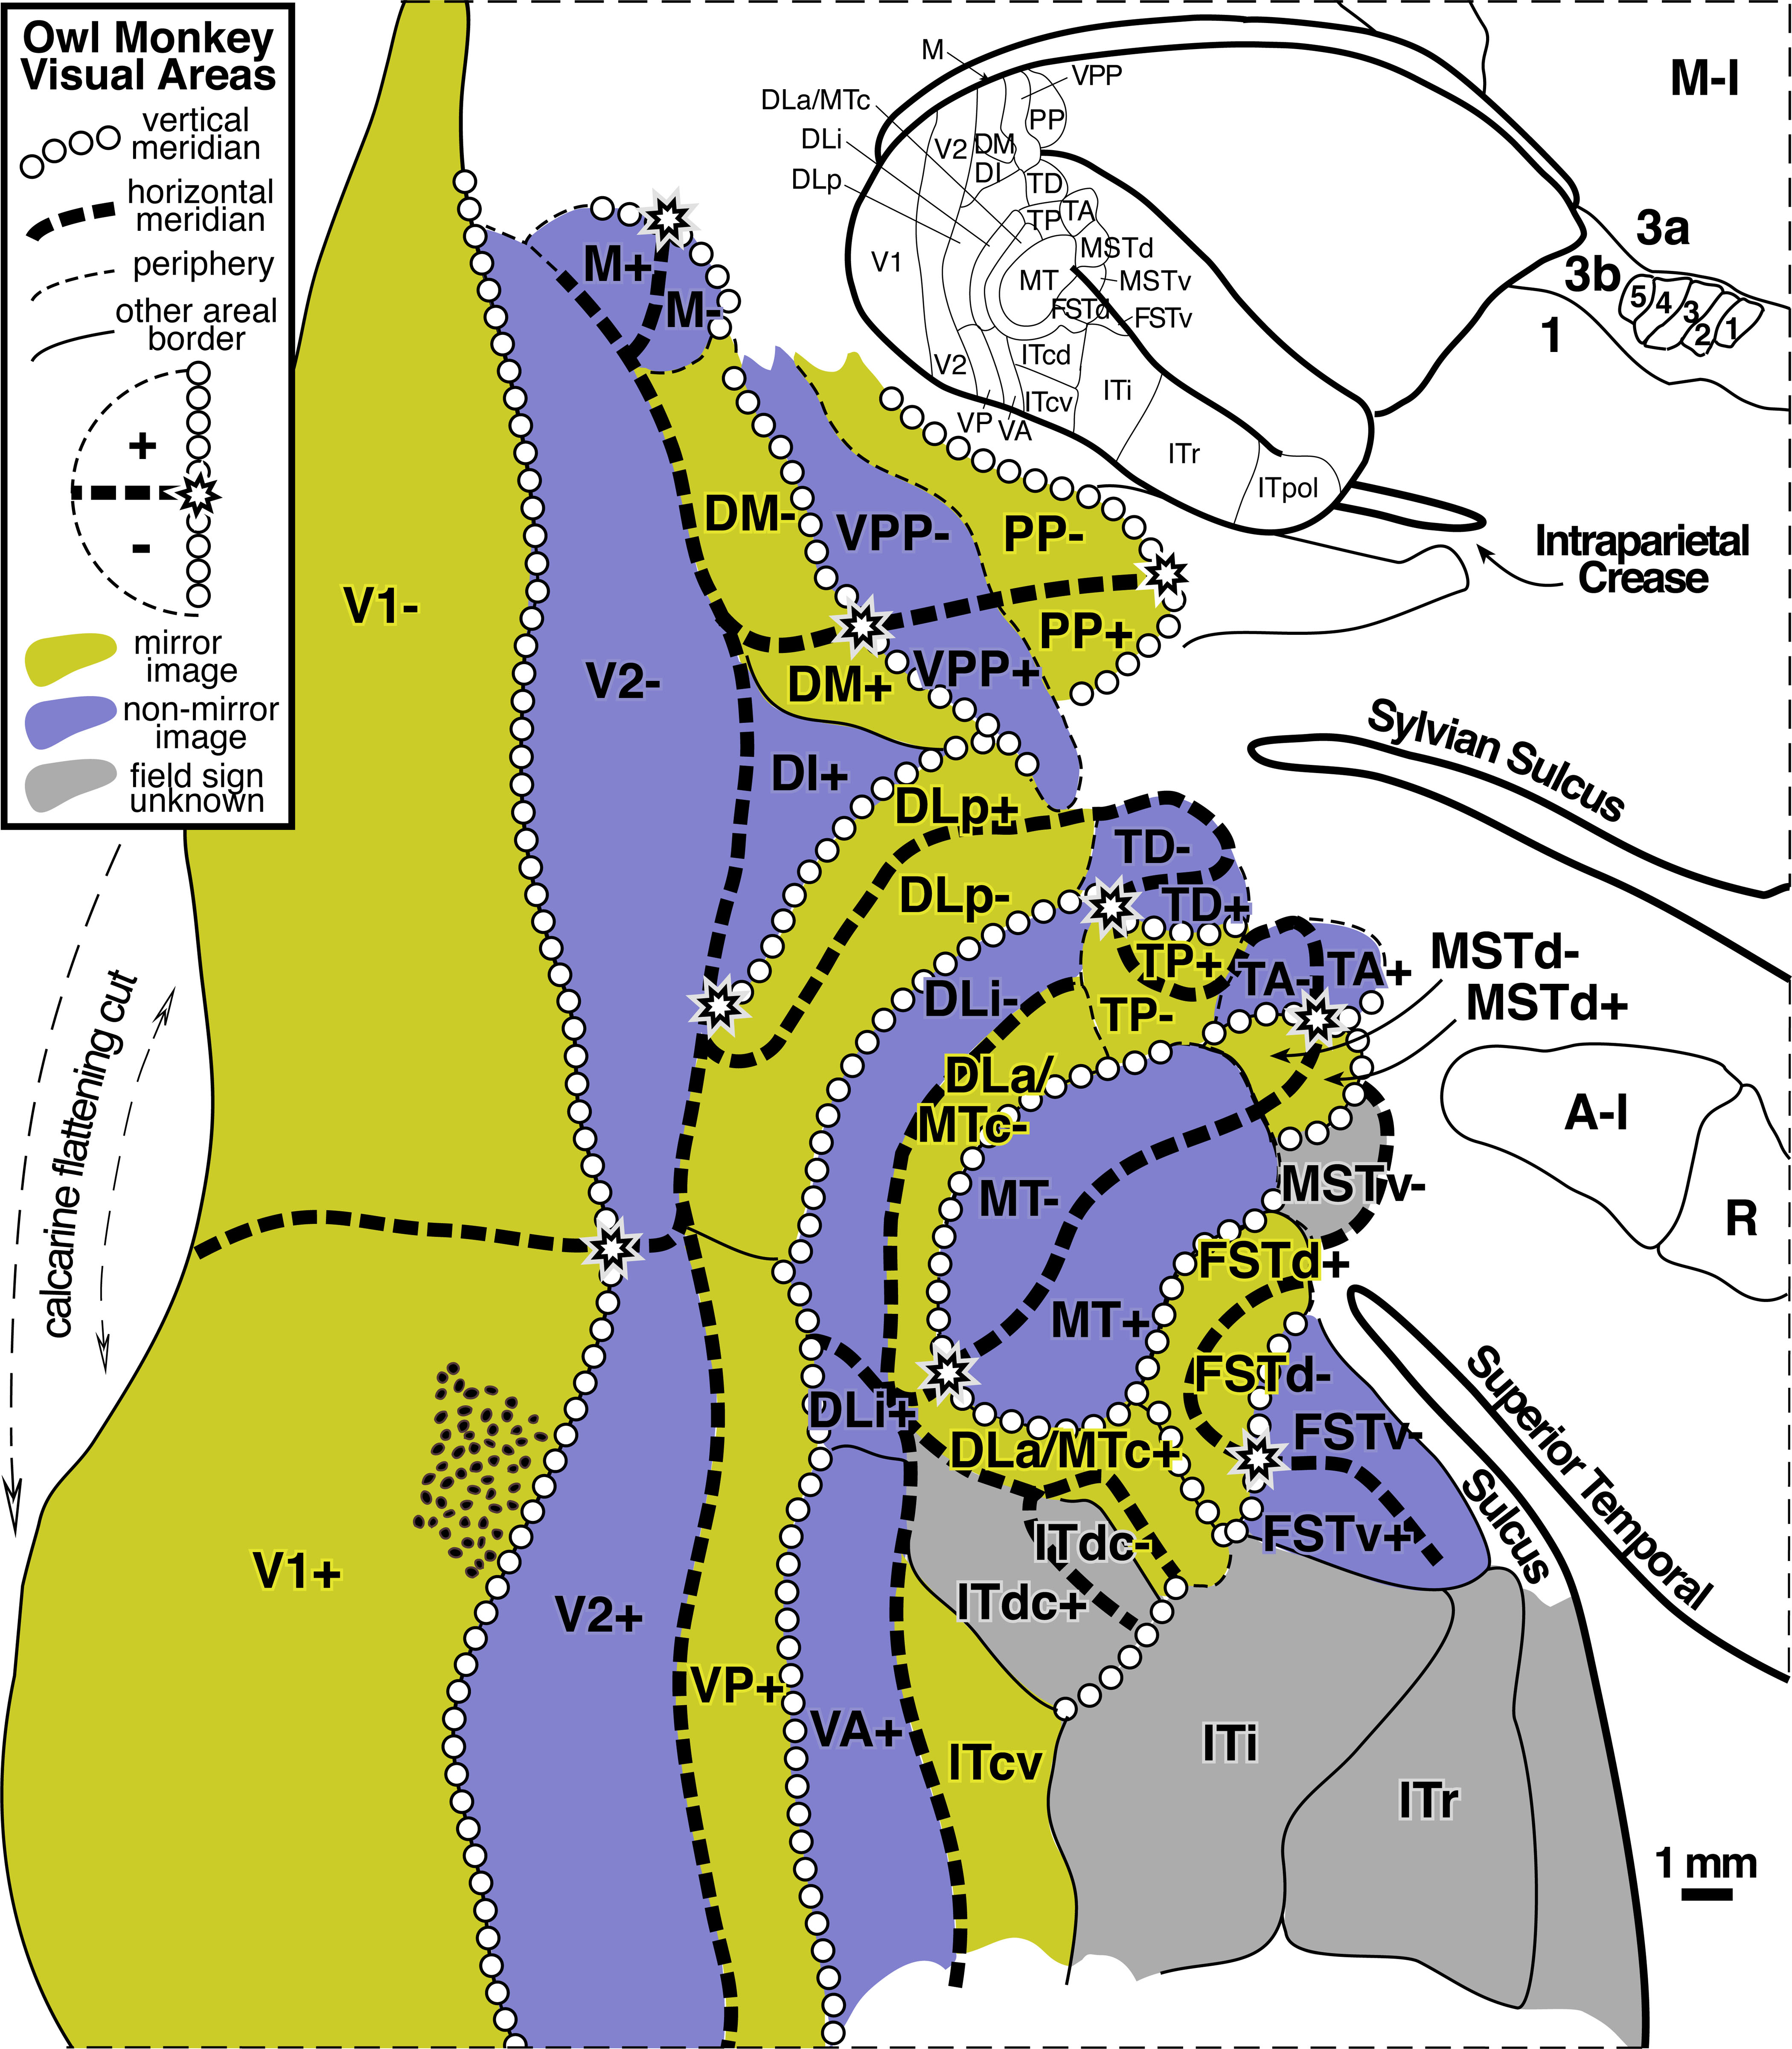
Figure 2. Owl monkey visual areas. Almost all of the 24 areas shown
are retinotopic. Many contain partial representations of the visual
field. Modified from Sereno et al. (2015).
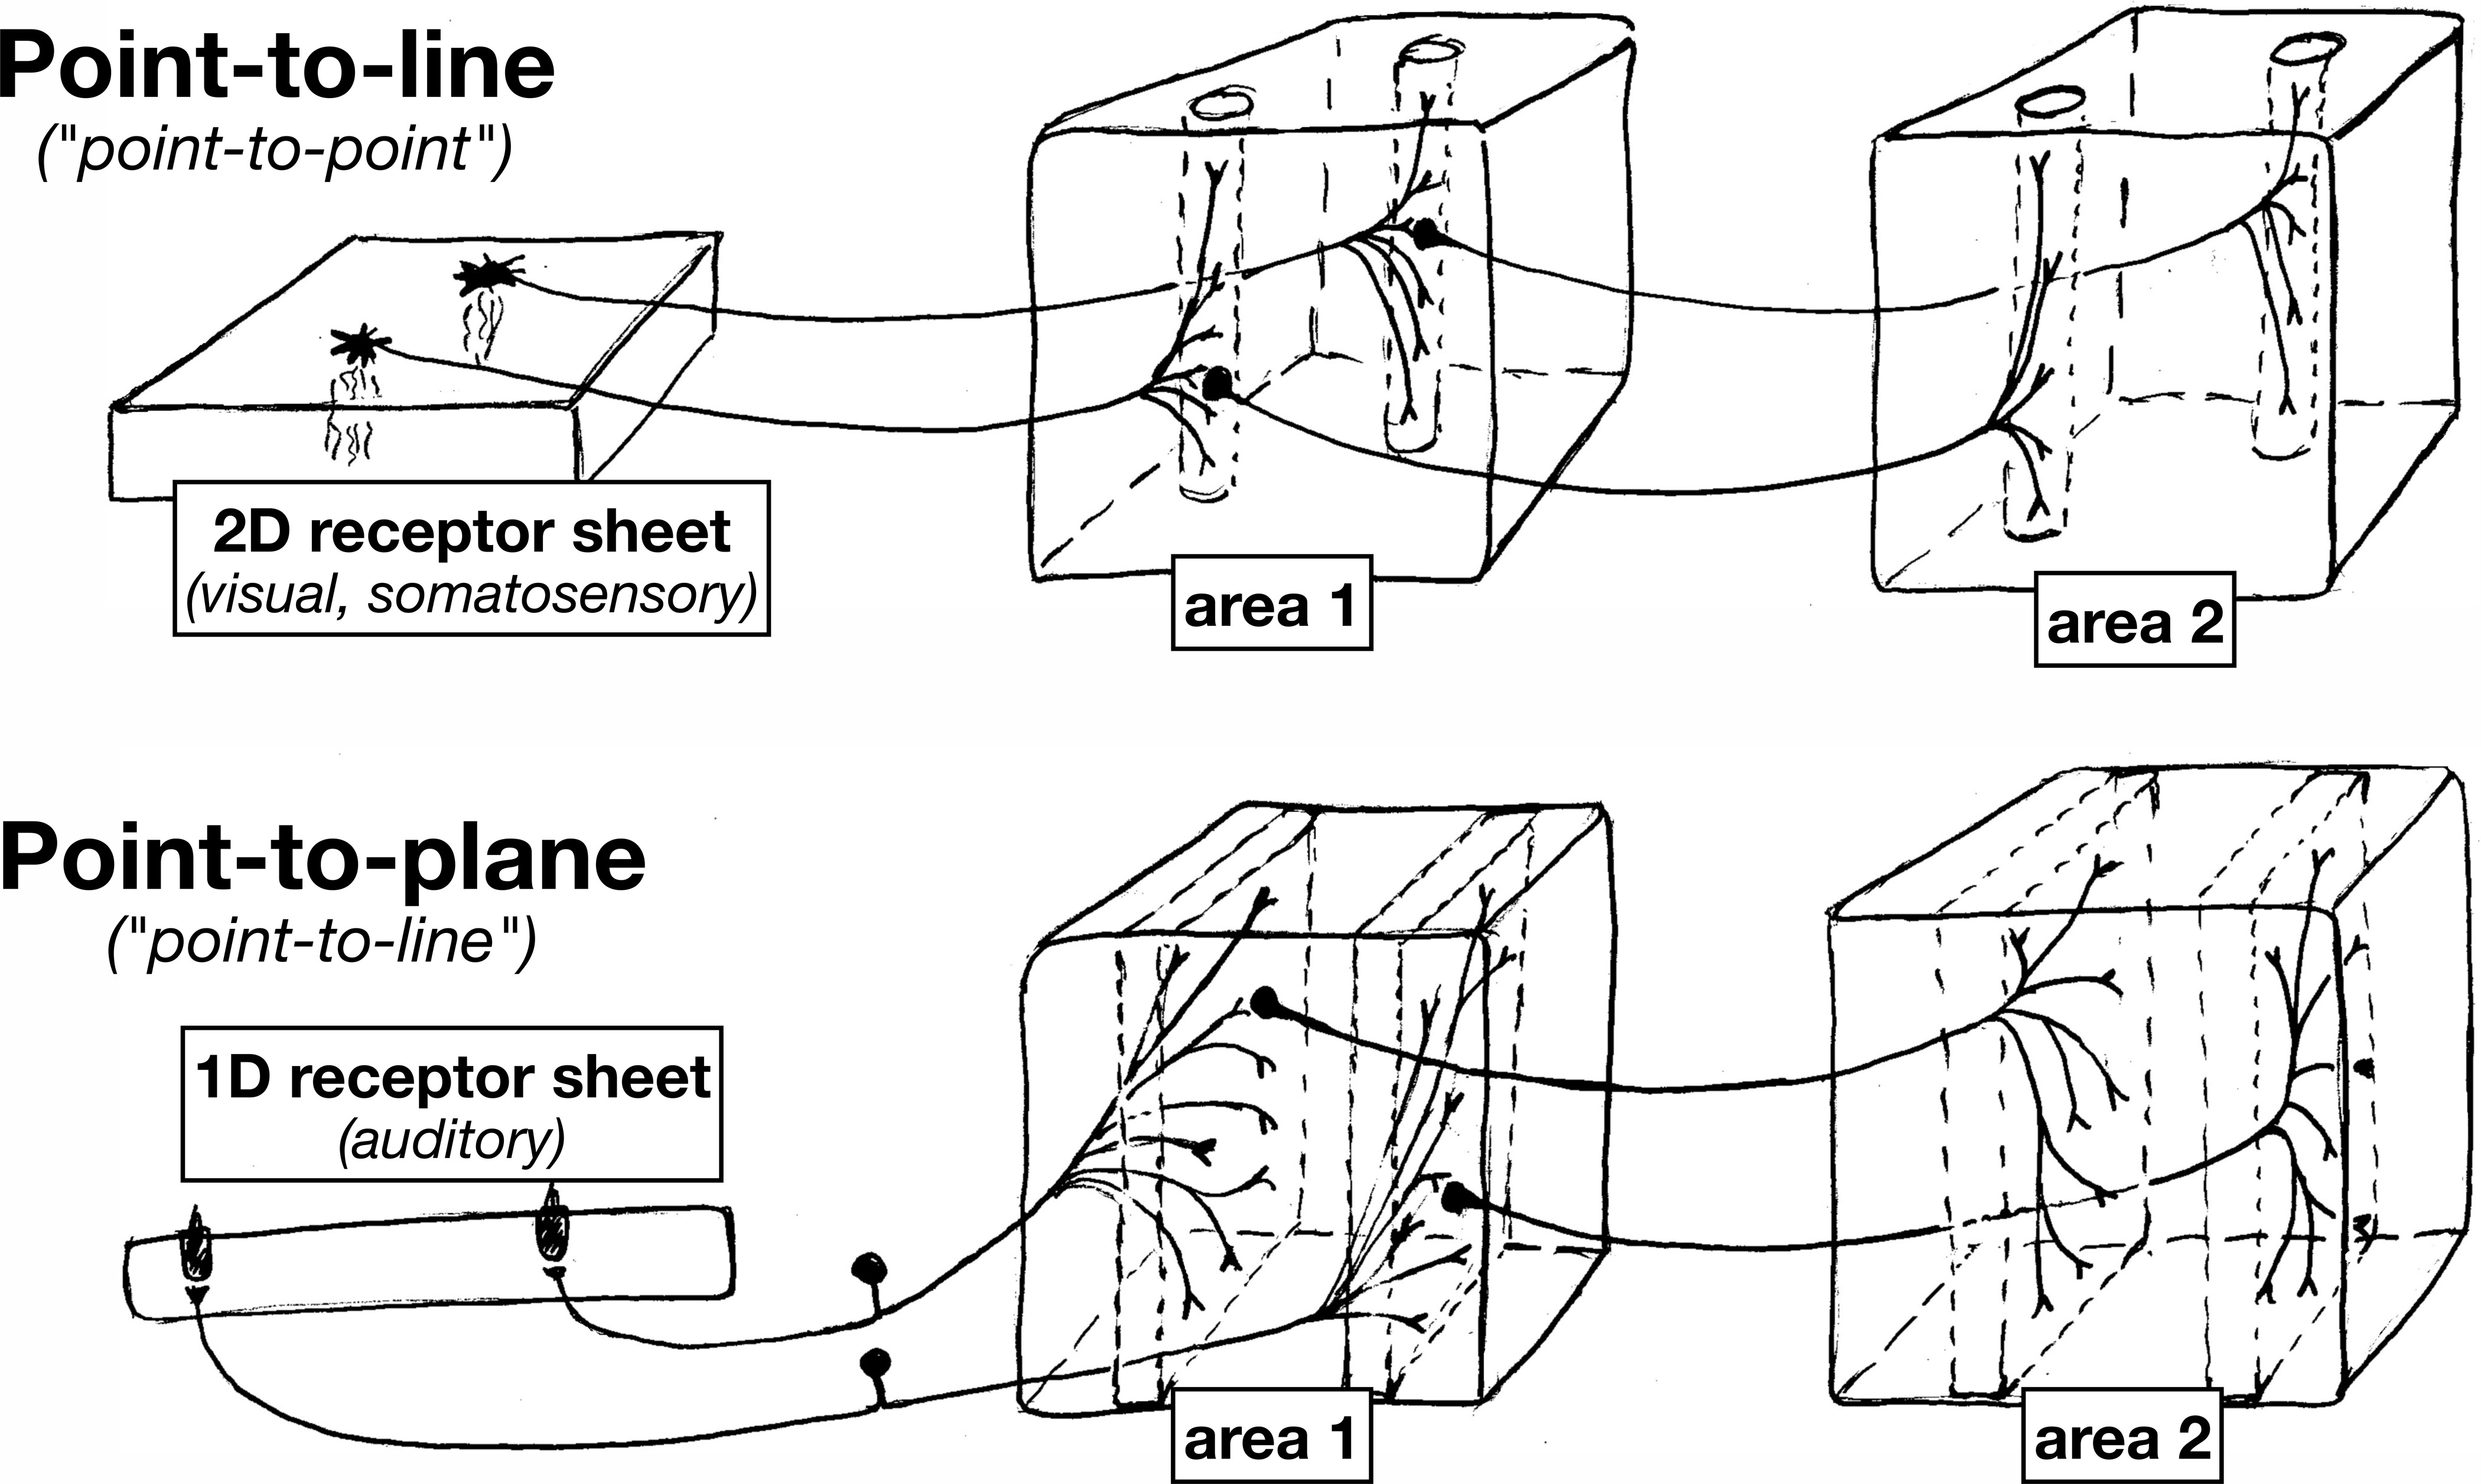
Figure 3. Since auditory receptors form a 1D line, in contrast to 2D
sheets of visual and somatosensory receptors, subsequent approximately
topological station-to-station connections between nuclei in the auditory
system have an 'extra' dimension across which to spread.
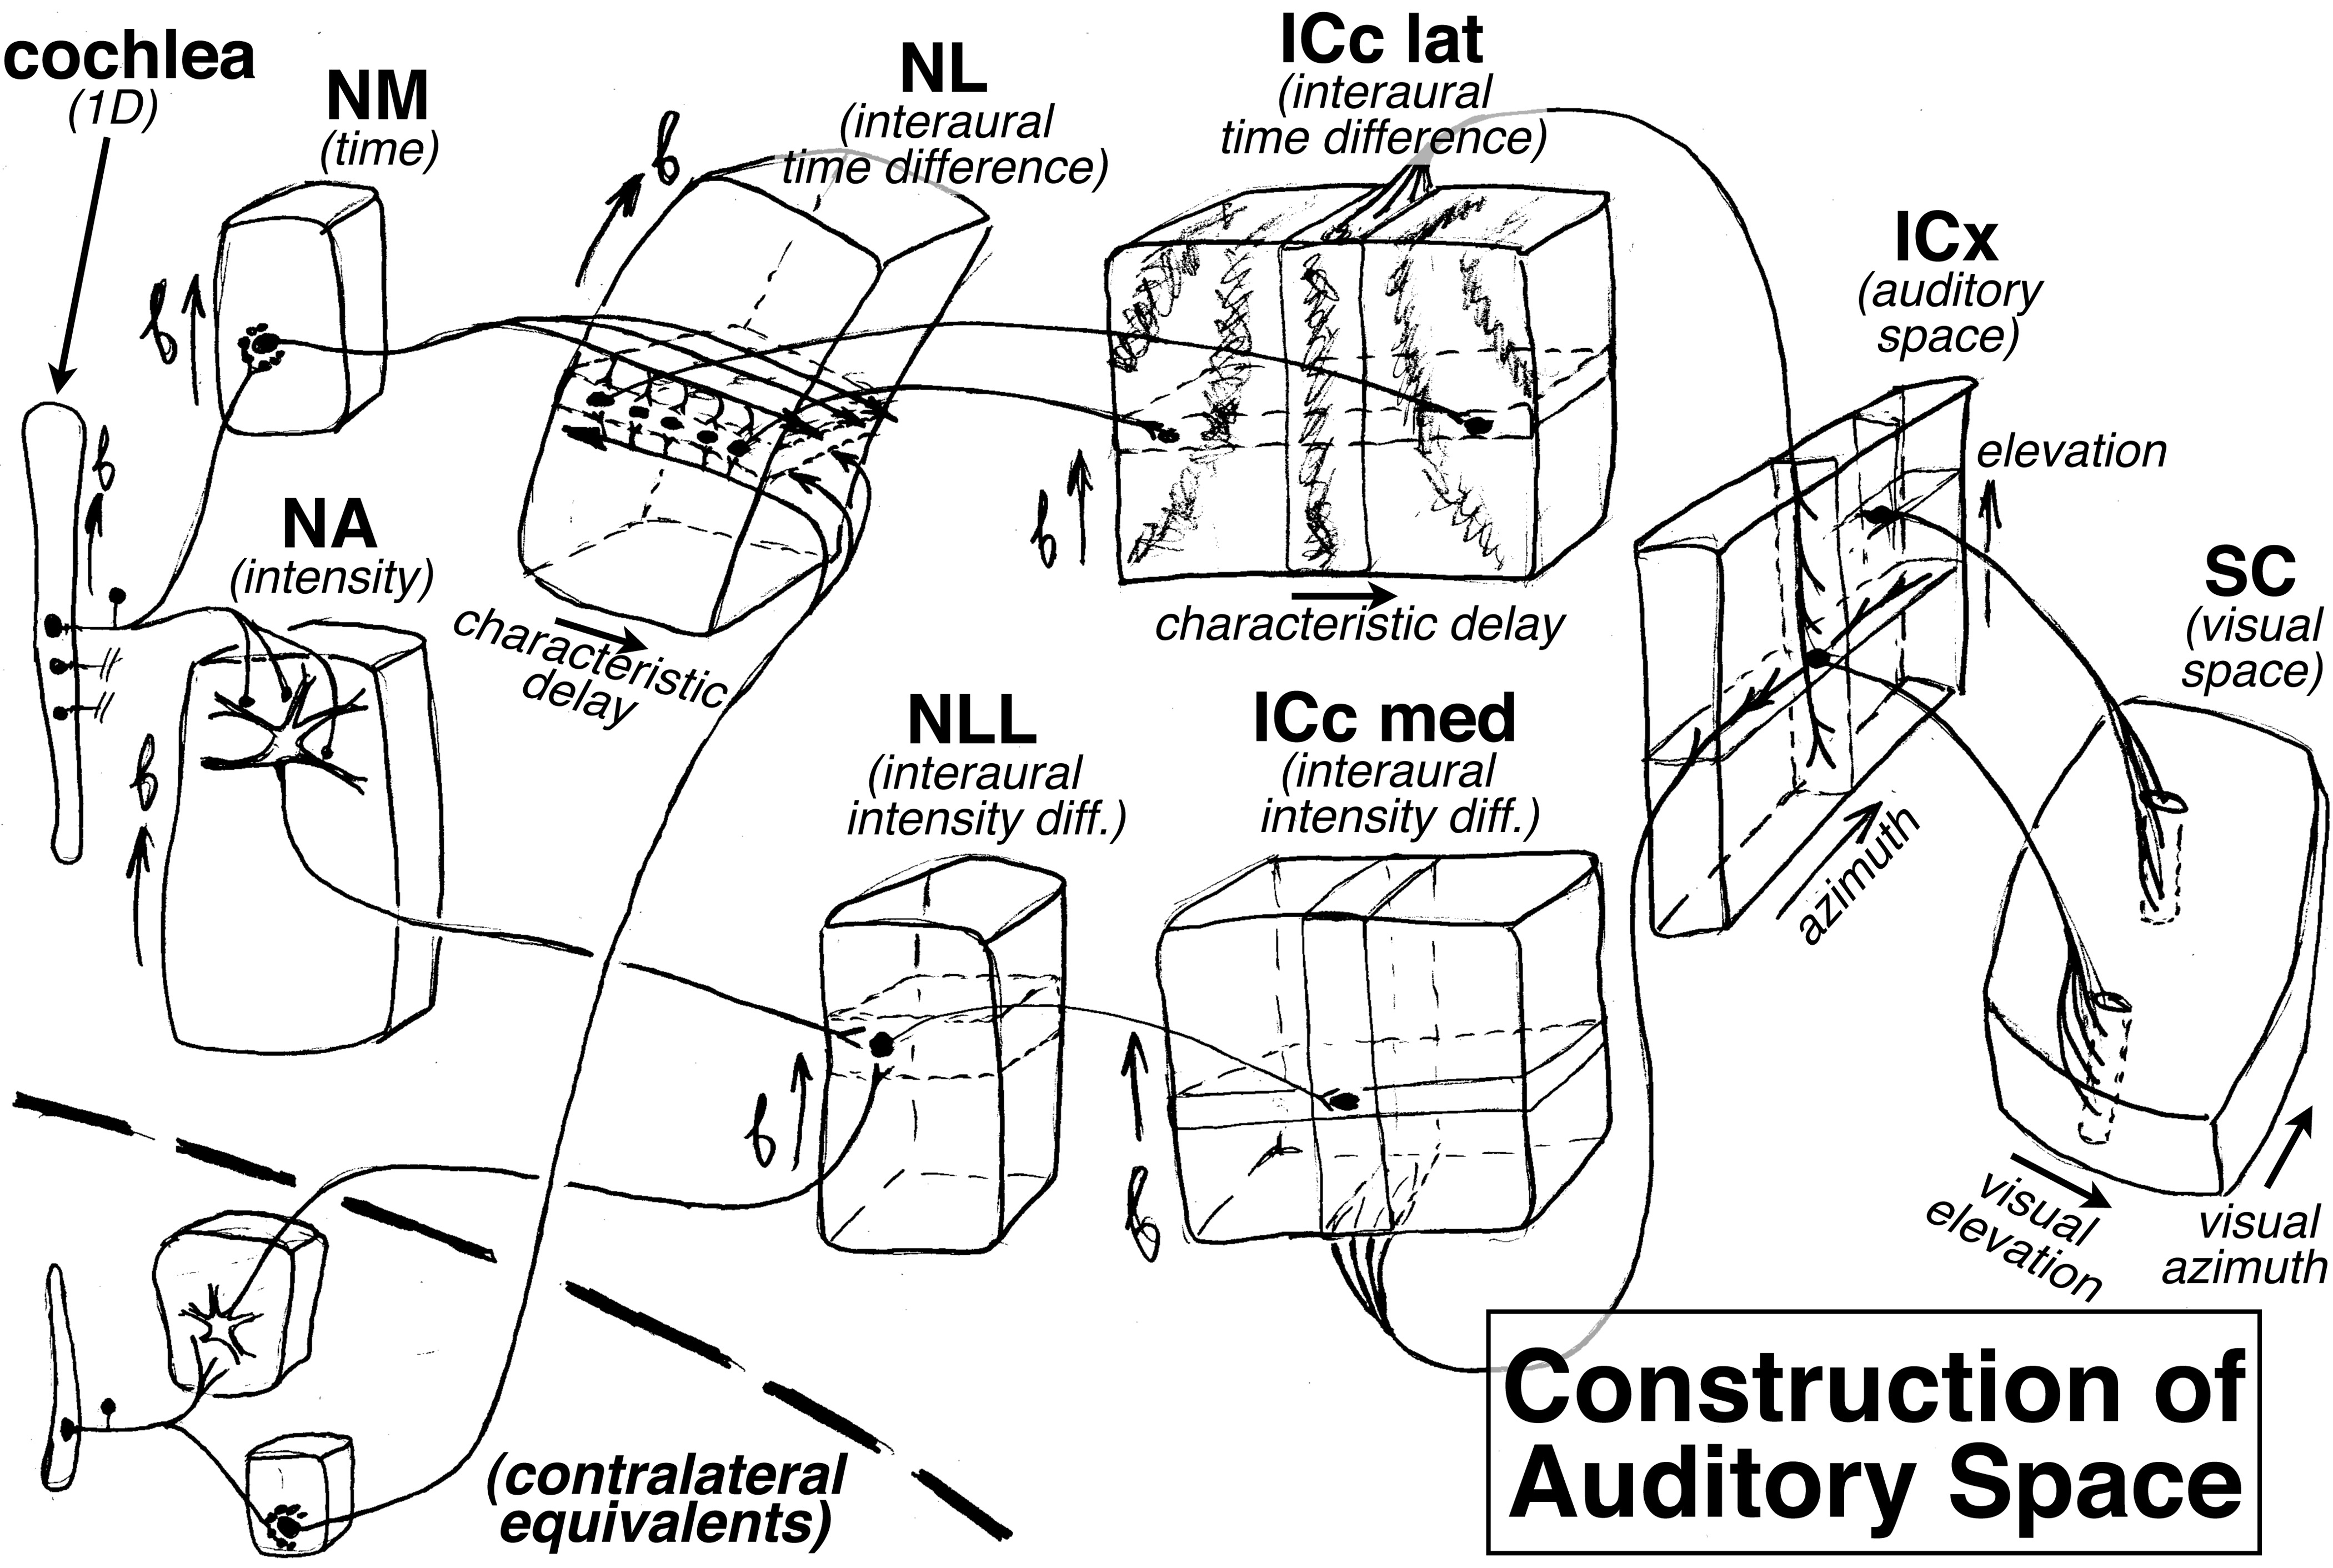
Figure 4. How the auditory system plays with maps: construction of an
auditory space map from two (left, right) frequency maps in the barn
owl. The 'extra' dimension perpendicular to tonotopy is used to construct
maps of other features, such as characteristic delay in the nucleus
laminaris (NL) and the inferior colliculus central nucleus lateral part
(ICc lat), and eventually an auditory map of space in the external nucleus
of the inferior colliculus (ICx), which is finally sent to the superior
colliculus (SC).
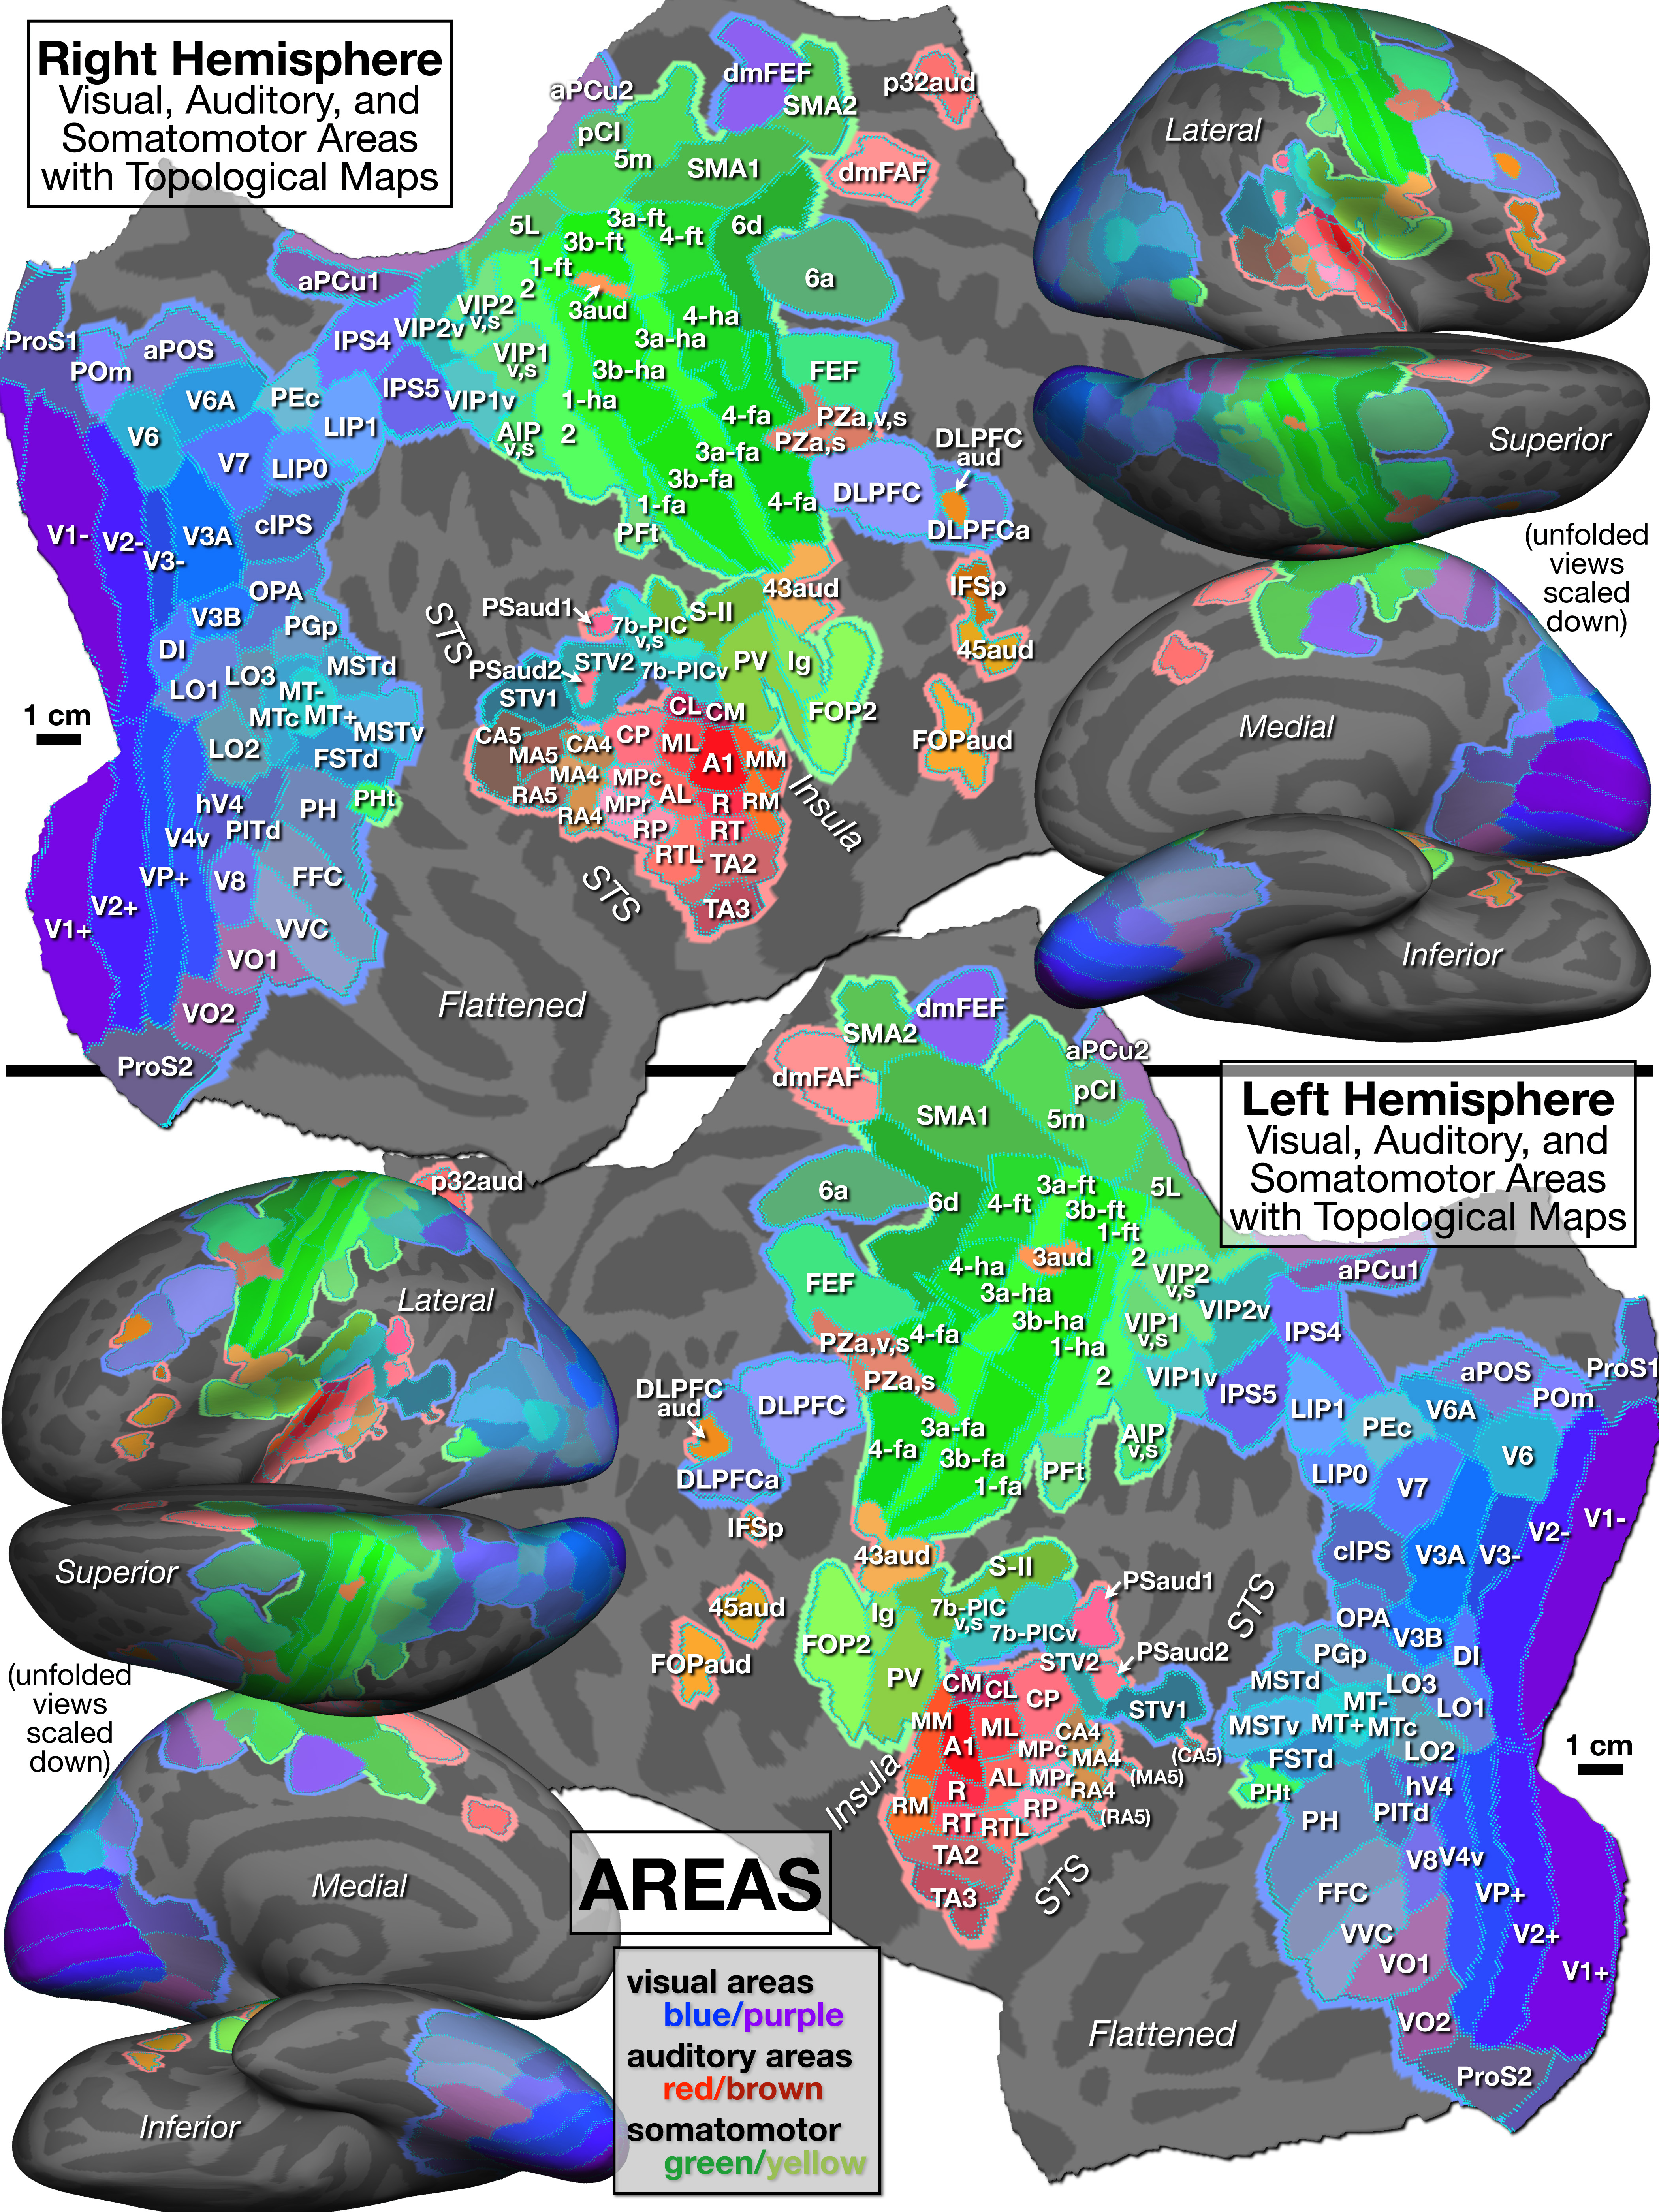
Figure 5. Parcellation of cortical areas containing topological
sensorimotor maps as defined by significant amplitude response and
significant phase spread to phase-encoded visual (blue/purple), auditory
(red/brown), and somatomotor (green) mapping stimuli. See identically
arranged Figure 6 for supporting mapping data and Table 1 for abbreviation
definitions.
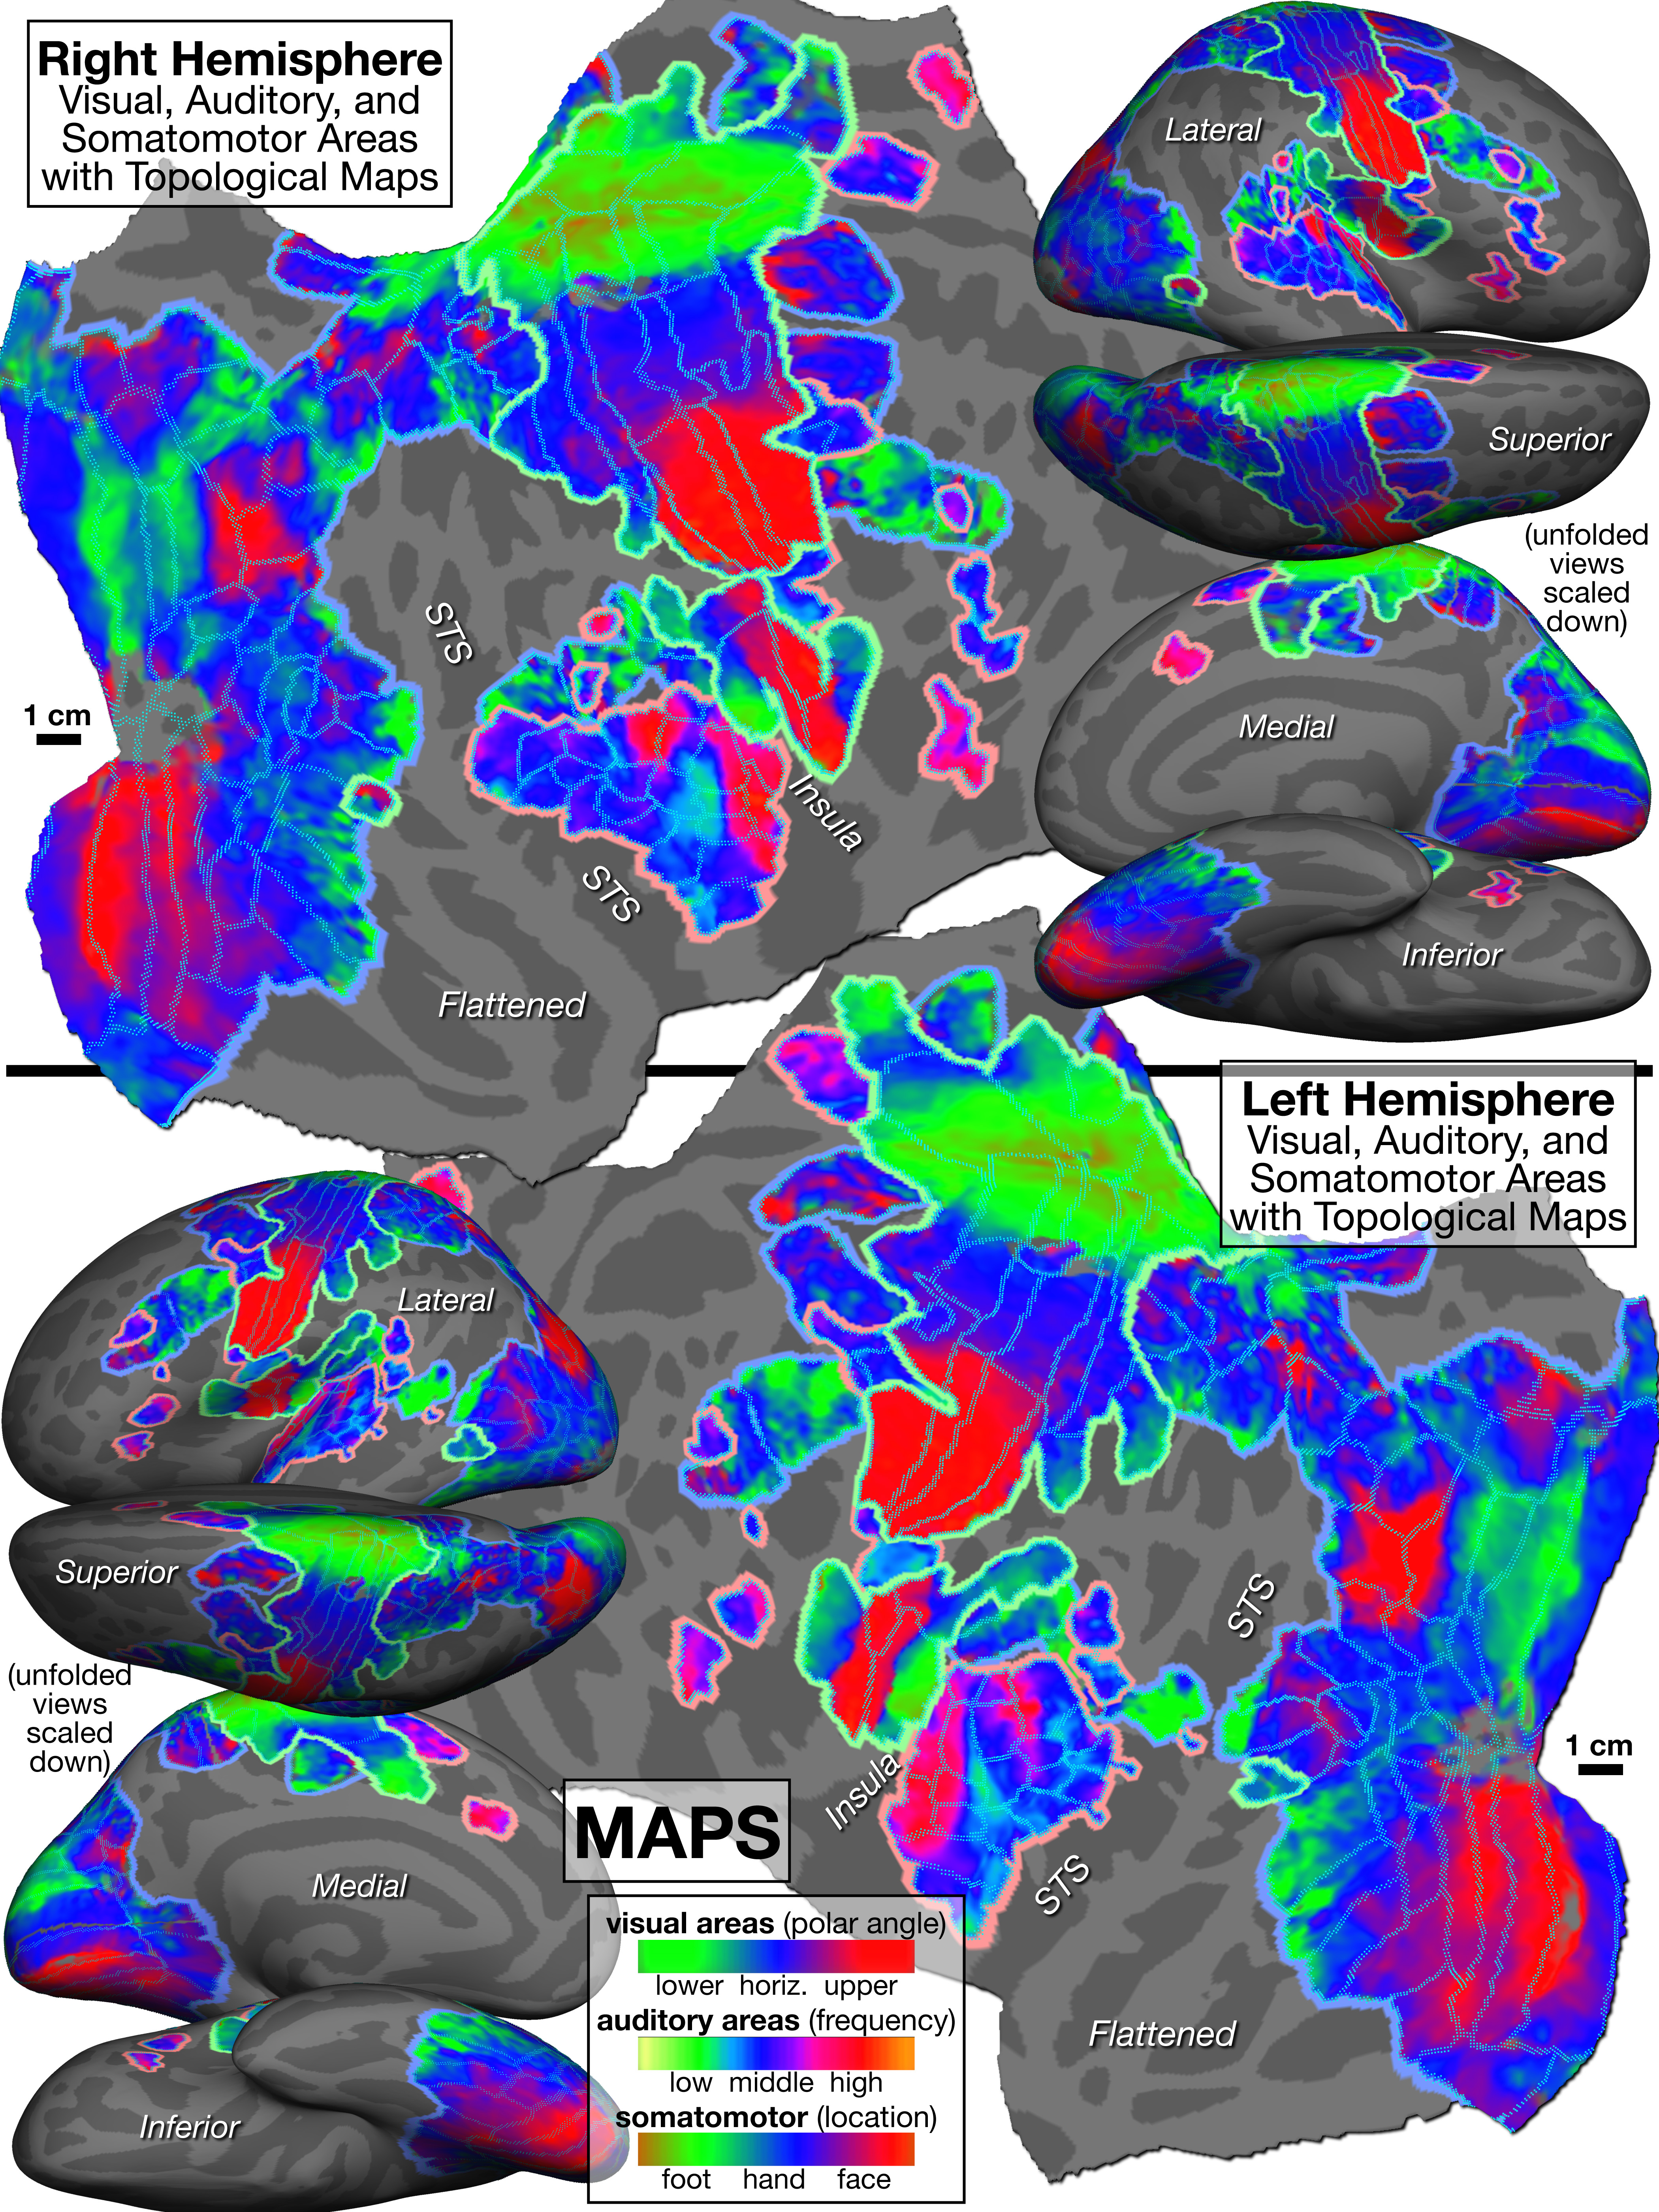
Figure 6. Topological cortical maps defined by periodic response to
phase-encoded mapping stimuli (visual: clockwise/counter-clockwise
rotating polar angle wedges; auditory: ascending/descending
bandpass-filtered non-verbal vocalizations; somatomotor:
face-to-foot/foot-to-face bilateral, cued voluntary movements of
individual body parts). Color scales: green is lower field, low frequency,
or leg/foot; blue is horizontal meridian, mid frequency, or arm/hand;
red is upper field, high frequency, or face.
The GIF file blinks back and forth between the identically arranged Figure
5 and Figure 6, to see the relation between proposed areal boundaries
and visual, auditory, and somatosensory mapping data.
For details, see:
Sereno MI, Sood MR and Huang R-S (2022)
Topological Maps and Brain Computations From Low to High.
Frontiers in System Neuroscience 16:787737
https://pages.ucsd.edu/~msereno/papers/MapsLowToHigh22.pdf
(doi: 10.3389/fnsys.2022.787737)